
1. Executive Summary
The ENERGY STAR Portfolio Manager® is a useful and well-designed online tool to measure and track energy and water consumption, along with the greenhouse gas emissions. The tool can benchmark the performance of a building or a complete portfolio of buildings. The required data inputs for ENERGY STAR Portfolio Manager® are energy bills and building’s basic information. The ENERGY STAR Portfolio Manager® Web-based solution can set an energy use target and see how much energy a property under design might use compared to similar existing buildings nationwide. In total, ENERGY STAR Portfolio Manager® can track more than 100 different metrics and uses them to compare a building’s performance against a yearly baseline (cf. Appendix A), national medians, or similar buildings under a portfolio. The ENERGY STAR Portfolio Manager®: (1) assigns buildings an ENERGY STAR score between 1 and 100, which compares a building’s energy performance to similar buildings nationwide, (2) calculates a building’s greenhouse gas emissions from energy use, (3) allows comparing cost savings across buildings under a portfolio, (4) generates ENERGY STAR performance documents for each building by summarizing important energy information, and (5) allows for the sharing of performance data with others.

An algorithm proposed and patented by Screaming Power Inc uses similar patterns as ENERGY STAR Portfolio Manager® including weather normalization (WN) of energy data. The algorithm also forecasts energy use based on the forecasted weather data. Different from ENERGY STAR Portfolio Manager®, the Screaming Power’s algorithm does not rely solely on temperature data or heating/cooling degree days, it takes into consideration other weather parameters including wind speed, solar radiation, and humidity which are increasingly becoming an issue with the effects of Global Warming and more extreme weather conditions.
This article provides a detailed comparison between the ENERGY STAR’s Portfolio Manager-, the most commonly used state-of-the-art tool recommended by US and Canadian Government entities and Screaming Power’s newly proposed weather normalization algorithm to pinpoint their merits and demerits over each other.
In the following, Section 2 highlights the key aspects of ENERGY STAR Portfolio Manager®. Section 3 and 4 reproduce the weather normalization and Energy Star scoring processes, by ENERGY STAR Portfolio Manager®. Section 5 gives an overview of Screaming Power’s weather normalization algorithm. Section 6 compares the two weather normalization algorithms in detail. Section 7 discusses other relevant features of ENERGY STAR Portfolio Manager® and Section 8 presents two alternative methods of normalizing energy data from the weather. Finally, Section 9 summarizes the differences between the algorithms and gives concluding remarks.
In the following, we highlight some key energy management aspects in ENERGY STAR Portfolio Manager® we consider more relevant while comparing with alternative approaches.
2. Key Energy Management Aspects in ENERGY STAR Portfolio Manager®
This section highlights the key aspects and measures considered in ENERGY STAR Portfolio Manager® to track and manage energy consumption for buildings. They include:
1) To account for the fact that different fuels will cover different loads in a building, ENERGY STAR Portfolio Manager® performs the normalization process for each fuel, e.g., electricity, gas, district steam, etc. separately and then it adds the normalized values for each fuel together to get the total normalized value for a property.
2) The ENERGY STAR Portfolio Manager® normalization process requires monthly complete data to determine the relationship between monthly energy consumption and monthly temperature.
3) The methodology ENERGY STAR Portfolio Manager® uses for weather normalization (WN) of energy data is based on E-Tracker, a tool developed by Dr. Kelly Kissock of the University of Dayton.
4) Findings by ENERGY STAR Portfolio Manager® suggest that energy consumed by commercial buildings do not significantly vary under normal (e.g., base temperature) or real weather (e.g., outside temperature) condition. Therefore, ENERGY STAR Portfolio Manager® does not tend to normalize energy use for commercial buildings. Rather, it provides a scoring mechanism for commercial buildings based on their Energy Use Intensity (EUI). Research by ENERGY STAR Portfolio Manager® suggests that the commercial buildings (please refer to Appendix B for building types and eligible building types) are not as sensitive to the outside temperature as compared to the residential buildings. Because, many commercial buildings are more likely to have ventilation systems that run all year round, regardless of temperature, and they may also have high internal loads due to computers and other heavy equipment, there is no significant difference in energy related to changes in outdoor temperature. The normalized weather metrics are available to ‘existing’ commercial buildings and are not merely in the design phase. A simulated building in the design phase (depending on the simulation model) may not accurately represent the cause-effect relationship between weather and energy, thus it is not given weather normalized metrics.
5) In ENERGY STAR Portfolio Manager®, weather normalized metrics are performed and displayed in the dashboard by default for buildings unable to obtain an ENERGY STAR score. For those able to obtain a score, weather normalized metrics can also be found in the reporting tool.
6) Normalization is based on the most recent 24 calendar months of data. If 24 calendar months of data are not available, the most recent 12 months are used and any other data are excluded from the analysis.
7) To explore the effects of humidity, ENERGY STAR Portfolio Manager® ran regression models that included Heating Degree Days (HDD), Cooling Degree Days (CDD), and Dew Point. This analysis showed that a separate relationship for humidity was not measured as statistically significant. It was observed that dew point is highly correlated with CDD. Therefore, in a regression analysis, statistically significant correlations for both CDD and dewpoint cannot be obtained. This indicates that the impact of dew point can be accounted for by the inclusion of CDD.
8) ENERGY STAR Portfolio Manager® performed analysis to look at Average Temperature as an alternative (or addition) to HDD and CDD. It was not found that Average Temperature offered a separate (or superior) correlation with Source Energy Use Intensity (EUI) than HDD and CDD on their own.
9) The ENERGY STAR Portfolio Manager® uses HDD and/or CDD as the primary indicators of weather conditions in the regression equations. Statistical correlations for these variables successfully account for weather differences across the country and additional terms for factors such as humidity are not shown to be effective.
10) Weather characteristics like humidity, HDD, CDD, and so on are correlated with each other. For example, it is, in general, understood that buildings with higher HDD tend to have lower CDD (e.g., colder climates). Similarly, buildings with higher CDD tend to have higher dew points (warmer, more humid climates). Dew point also strongly correlated with pressure and humidity. The ENERGY STAR Portfolio Manager® concluded that a regression analysis usually isolates the effect of one variable while simultaneously normalizing for the other variables. Therefore, when two independent variables are highly correlated with each other, it is reasonable to include only one of the two, because they end up capturing the same effect.
11) The goal of the efficiency score by ENERGY STAR Portfolio Manager® is to rate the primary use of the building, not supplemental parking or pool areas. To compute the score, ENERGY STAR Portfolio Manager® calculates a predicted source energy consumption for the use of parking or pool using engineered assumptions about the required energy needs. Then, after computing the actual source energy of the building, the prediction for the usage of parking and pool is subtracted from the actual energy use.
12) Weather-normalized energy adjustment is for weather only, but not climate. That is, the metric evaluates a building over time, but does not account for differences between a building and other locations that have different average (normal) climates.
13) For weather normalization, the actual daily temperature for each of the 24 calendar months is retrieved from the nearest weather station.
In the below, we briefly describe the weather normalization process as proposed and used by ENERGY STAR’s Portfolio Manager.
3. Weather Normalization process in ENERGY STAR Portfolio Manager®
Step 1: User Enters energy data into ENERGY STAR Portfolio Manager® (only step required by user)
o Monthly bills are required for weather normalization (WN) because energy use is compared to monthly weather data.
o The weather normalization is not applicable for fuels that are delivered in bulk.
Step 2: Portfolio Manager Splits Energy Data into Whole Calendar Months
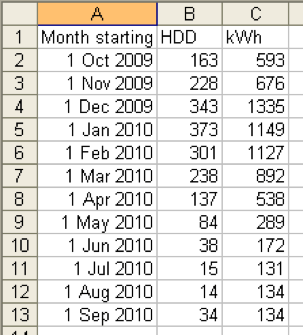
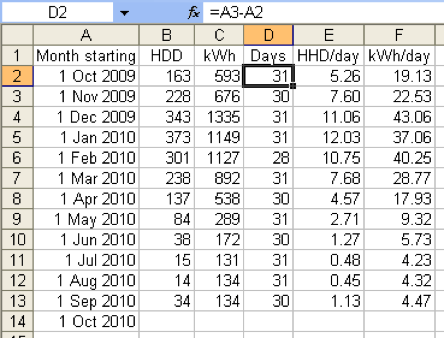
o Data is apportioned to calendar months based on the average energy use per day. For example, if a bill runs from January 10 through February 9, it covers 31 days: 22 in January and 9 in February. Of the total bill, 22/31 (71%) is assigned to January and 9/31 (29%) is assigned to February.
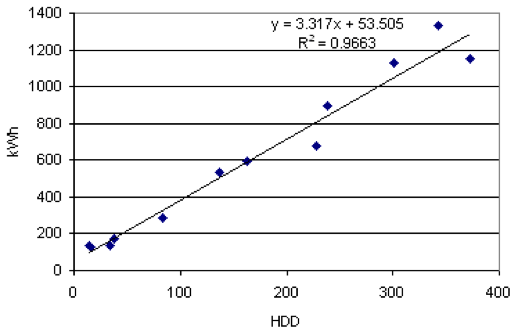
Step 3: The ENERGY STAR Portfolio Manager® plots energy use and actual temperature for each fuel
o The actual temperature for each of the 24 calendar months is retrieved from the daily weather station and plots are generated with energy on the vertical (Y) axis and temperature on the horizontal (X) axis. Separate plots are created for each fuel type in the building.
Step 4: The ENERGY STAR Portfolio Manager® calculates the relationships between energy and temperature
(for each independent variable, e.g., actual average monthly temperature, Heating Degree Days (HDD), and Cooling Degree Days (CDD), and considers the best fit)
o For each individual fuel type, a series of linear regressions is performed to determine the equation of the best fit line for the building, based on the solution with the highest correlation (R2).
o Different fits are explored to account for how a fuel is used in a building for a particular purpose. The regression process reviews all potential profiles and adjusts the “change” points where the curve shifts, to find the solution with the highest R2.
o It is possible to have no calculated fit, i.e., a building’s energy does not vary significantly as temperature changes. This may be true for buildings that use electricity for only the base load, buildings that have limited heating or cooling loads, or buildings with high internal loads like data centers and hospitals. EPA requires a minimum R2 that varies based on the type of fit, ranging from 0.4 for simpler fits to 0.7 for more complex fits.
Step 5: The ENERGY STAR Portfolio Manager® computes a normalization ratio for each fuel type
(the key step in their weather normalization process)
o For each fuel type, this is a ratio of the expected energy for the average (normal) climate year to the expected energy of the current year (12-month period selected). The expected energy values are computed using the relationship from Step 4, and solving for energy using the average (normal) climate temperatures and the actual daily temperatures, respectively. The expected values represent the energy a building would use if it exactly followed the regression equation. For example, if the current year is very hot, a building might be expected to use twice as much energy than under average (normal) climate conditions. The normalization ratio would be ½. The actual energy would be multiplied by ½ to determine what would have been used if it had not been so hot.
Step 6: The ENERGY STAR Portfolio Manager® computes normalized energy
o The actual annual energy is multiplied by the normalization ratio to provide a weather normalized value for each individual fuel at the building.
o The weather normalized values of all fuel types are added together. This aggregate normalized value represents the energy the building would have used under average (normal) climate conditions.
The ENERGY STAR Portfolio Manager® also provides a scoring mechanism for commercial buildings on the Scale 1 to 100 based on their energy use intensity (EUI). In the following, we highlight the steps for ENERGY STAR scoring.
4. Energy Star Score calculation process in ENERGY STAR Portfolio Manager®
The ENERGY STAR score is an external benchmark for assessing the performance of commercial buildings. To receive an ENERGY STAR score in ENERGY STAR Portfolio Manager®, one must enter 12 full calendar months of energy data for all energy types, in addition, to complete data on property use details such as hours of operation and workers.
To determine the score, ENERGY STAR Portfolio Manager® computes both the actual source energy use intensity (EUI) and the predicted source EUI based on these inputs. The ratio of actual source EUI to predicted source EUI is the efficiency ratio, which can be mapped through a lookup table to determine the 1 – 100 ENERGY STAR score.
Step 1: User enters building data into ENERGY STAR Portfolio Manager®
o 12 months of complete energy use information for all energy types
o Specific physical building information (size, location, etc.)
o Specific use details describing building activity (hours, etc.)
Step 2: Portfolio Manager- Computes the Actual Source EUI
o Total energy consumption for each fuel is converted from site energy into source energy
o Source energy values are added across all fuel types
o Source energy is divided by gross floor area to determine actual source EUI
Step 3: Portfolio Manager- Computes the Predicted Source EUI
o A regression equation for each property type is used to determine predicted source EUI
o The equation begins with the average EUI (baseline EUI or Y-intercept) for the property type and makes a series of adjustments based on the usage details (hours, workers, etc.)
Step 4: Portfolio Manager- Computes the Energy Efficiency Ratio
o The ratio equals the actual source EUI divided by predicted source EUI
o Lower ratios indicate better performance
Step 5: Portfolio Manager- Uses the Efficiency Ratio to Assign a Score via a Lookup Table
o For each score on the 1 -100 scale, the lookup table provides a range of ratio values
o The ratio from Step 4 is used to identify the score
o A score of 75 indicates that the building performs better than 75% of its peers
The primary analysis used in ENERGY STAR Portfolio Manager® is a weighted ordinary least squares regression, which evaluates source EUI relative to business activity (e.g., operating hours, the number of workers, and climate). This linear regression yields an equation to compute Source EUI (also called the dependent variable) based on a series of characteristics that describe the business activities (also called independent variables).
Source EUI = Co + C1*Characteristic1 + C2*Characteristic2 + …
Where Co represents a constant term and the other C values are regression coefficients. Each equation coefficient is a number that represents the correlation between the operating characteristic and the building’s source EUI.
ENERGY STAR Portfolio Manager® provided one of the very original and effective weather normalization (WN) algorithm and energy management system. Buildings are very complex structure and it is not very feasible to measure every corner and sides of building to account them for energy consumption and energy conservation. Screaming Power Inc came up with a method that can automatically infer many building properties including material types used based on regression analyses. The weather normalization algorithm not only considers temperature as the primary weather factor that influences energy use, it also considers other weather characteristics like solar radiation, wind speed, and humidity as equally important factors with temperature.
5. Screaming Power’s Weather Normalization Method
Step 1: Receive and retrieve raw energy information from the utility providers
– Energy data may include any type of fuel.
Step 2: Receive and retrieve weather information from a meteorology provider
– The weather information includes temperature, wind speed, humidity, and solar radiation information.
Step 3: Identify format and type of raw energy use data and weather information
Step 4: Re-format or convert raw energy use data and weather information
– For example, converts the raw energy use data and weather information to different units of measurement.
Step 5: Validate raw energy use data and weather information
Step 6: Remediate raw energy use data and weather information
Step 7: Generate Energy Use Intensity Value (EUI)
Step 8: Calculate Heating Load, Cooling Load, Active Baseload, and Passive Baseload based on linear and non-linear models
Step 9: Generate a temperature normalized EUI value, which relies on an EUI value for a structure at a time period, a baseload value for the time period, and corresponding weather information for the time period, and optionally, a building occupancy parameter.
Step 10: Generate a forecasted EUI value for a future time period using linear and non-linear models
– Optionally, generate a forecasted temperature-normalized EUI value for a future time period using linear and non-linear models.
In the following, we compare the two weather normalization algorithms against a number of factors. The goal is to compare both the algorithms from the same ground and highlight their strengths.
6. A Detailed Comparison between ENERGY STAR’s Portfolio Manager® and Screaming Power Weather Normalization Method
For the sake of examples, we consider various measurements and constraints that are applicable to US sites and properties. Canadian sites and properties might impose slightly different measurements and constraints. Nevertheless, the goal of this comparison is not to compare US and Canadian site/property measures and constraints, rather, to compare ENERGY STAR Portfolio Manager® regardless of the sites in US/Canada with the Screaming Power weather normalization aspects. They include:
Baseline Year
– In the ENERGY STAR Portfolio Manager®, the default Baseline Year is calculated as the first year for which a property has 12 full months of data. It is represented by a Baseline Date that is the last day of a year, for example, 12/31/2016.
– In the Screaming Power weather normalization algorithm, the Baseline Year is calculated, if the energy data available, primarily based on the fiscal year, e.g., starting from September for a given year.
Electric Demand and Cost
– The ENERGY STAR Portfolio Manager® calculates the following metrics related to the Electric Demand and Electric Demand Cost. The metrics are not weather normalized.
o Annual Maximum Demand (kW), the highest demand value across all electric meters and all meter entries covered in the 12-month performance period.
o Annual Maximum Demand (MM/YYYY), the month and year within the 12-month period that had the highest demand.
o Annual Maximum Demand (Meter Name (Meter ID)), the name of the meter that had the highest measured demand, and the Meter ID that was assigned by ENERGY STAR Portfolio Manager® when the meter was created.
o Annual Demand Cost ($), the sum of all demand costs across all months and all meters in the 12-month performance period.
– The Screaming Power weather normalization calculates the Annual Maximum Demand (kW) and Annual Demand Cost ($) metrics which can be weather normalized. The Screaming Power weather normalization does not calculate the Annual Maximum Demand (MM/YYYY) and Annual Maximum Demand (Meter Name/ID) in its current version.
Model and Regression Analysis
– In ENERGY STAR Portfolio Manager®, for each individual fuel type, a series of linear regressions is performed to determine the equation of the best-fit line for the building, based on the solution with the highest correlation (R2). It is important to note that HDD and CDD are not the only ways to quantify climate and weather. There are other measures such as temperature, humidity, cloud cover, and precipitation. When two independent variables are highly correlated with each other, it is prudent to include only one of the two, because they end up capturing the same effect. As the bottom-line, ENERGY STAR Portfolio Manager® used only the linear regression model with only one weather parameter which has the highest correlation and their conclusion is HDD and CDD – the Degree Days has the highest correlation with energy consumption behavior. The ENERGY STAR Portfolio Manager® linear model: gbl(T) = α + aT
– Screaming Power not only employs a linear model, with the evidence it shows that non-linear model performs better. Since one of Screaming Power’s goals is to predict energy use (regardless of a number of independent variables in our prediction model), Screaming Power’s algorithm utilizes a Neural Network machine learning technique and performs test-training cross-validation, which builds a model on a subset of data and predicts the results on the remaining data.
GHG Emission Calculation
o The ENERGY STAR Portfolio Manager® calculates the total GHG emission based on Direct and Indirect emissions, which are associated with onsite fuel combustion like natural gas/oil and purchases of electricity/district steam/hot water/chilled water (these emissions occur at the utility’s plant not at one’s property), respectively. ENERGY STAR Portfolio Manager® also calculates and makes available Offsite Avoided Emissions to the user, as well as gives credit to Onsite Avoided emissions by providing a zero emission in your Total Emissions.
– The Screaming Power weather normalization calculates the total GHG emission also based on the Direct and Indirect emissions only. Screaming Power weather normalization plans to subtract the Onsite Avoided emissions like onsite solar panels or wind turbine that might have a significant impact on reducing GHG emission.
Minimum Weekly Operating Hours
– There is a minimum number of Weekly Operating Hours to be analyzed and to receive a score by ENERGY STAR Portfolio Manager®, for example: for a property in the US 30 hours (same as Canada), with an exception for the hotels/hospitals and the religious worship facilities.
– With Screaming Power weather normalization, there are no constraints on weekly operational hours, i.e., it can normalize for any given working hours and for any energy consumed.
Minimum Property Size
– For ENERGY STAR Portfolio Manager®, for a property in the US, for example, there is a minimum property size to be analyzed and receive a score, which is at least 5,000 sq. ft. (i.e. 1,076 sq. ft. for a Canadian property) with these further constraints or exceptions:
o A bank must be at least 1,000 sq. ft. (same as Canada)
o A hospital must be at least 20,000 sq. ft. (1076 sq. ft. for a Canadian hospital)
o A religious worship facility must be at least 1,000 sq. ft. (same as Canada)
o Data centers do not have a square foot minimum
– For the Screaming Power weather normalization, there are no constraints on minimum property size, i.e., Screaming Power weather normalization can normalize energy usage for any given property of every size greater than zero.
Site EUI
– Both the ENERGY STAR Portfolio Manager® and the Screaming Power weather normalization provide Site EUI metric. They may rely on different measure unit systems including MKS or FPS.
Weather Normalized Site EUI
– The ENERGY STAR Portfolio Manager® calculates the weather normalized EUI to show the actual energy intensity.
– The Screaming Power weather normalization does not calculate and require the weather normalized EUI value for its purpose.
HDD and CDD Calculations
– The ENERGY STAR Portfolio Manager® calculates the HDD and CDD based on the 30 years’ average as 65 degrees Fahrenheit.
– The Screaming Power weather normalization calculates HDD and CDD based on 18 degrees Celsius as the 30 years’ average, which should be precisely 18.33 degree Celsius following the standard unit conversion.
Water Benchmarking
– The ENERGY STAR Portfolio Manager® can track the amount of water a property uses, and compare water use for that property over time or against other properties under a portfolio account. The ENERGY STAR is working to develop a scoring method between 1-100 to show a property’s water efficiency, specifically for multifamily buildings. There are no weather-normalized water metrics available.
– The Screaming Power weather normalization does not perform water benchmarking as of now since it only focuses on energy management.
Waste Tracking
– The ENERGY STAR Portfolio Manager® can also track Waste regardless of its type. Currently, ENERGY STAR Portfolio Manager® tracks 29 different types of Waste/Materials, everything from basic trash to cooking grease to appliances. One can track each of these 29 Waste/Materials according to one of four different “Waste Management Methods”: (1) recycled, (2) composted, (3) donated/reused, and (4) disposed. The disposed waste (trash) can be further categorized according to the “Disposed Waste Destinations”: (1) landfill, (2) incineration, (3) waste to energy, and (4) other/unknown.
To track the waste, one must know its weight and there are 2 ways to get the weight of Waste: (1) the container size (volume) and ENERGY STAR Portfolio Manager® calculates a weight and (2) enter the weight by getting the actual weight from the hauler.
ENERGY STAR Portfolio Manager® also defines some waste metrics and there are 4 Waste Intensity Metrics. They are all based on building’s Gross Floor Area (waste/GFA). The metrics include: (1) Total Waste (Disposed and Diverted) – Intensity, (2) Total Waste (Disposed and Diverted) – Cost Intensity, (3) Diverted Materials – Intensity, and (4) Diverted Materials – Cost Intensity.
The ENERGY STAR Portfolio Manager® does not calculate greenhouse gas emissions associated with the disposal of waste and materials.
– At present, the proposed Screaming Power weather normalization does not take account of the waste tracking. In the future, we will consider integrating the waste tracking and its various related metrics since they also have potentials in emitting GHG, which should be considered for GHG emission calculation.
Determining Baseload Value
– The ENERGY STAR Portfolio Manager® does not determine the baseload for each energy type.
– Screaming Power weather normalization algorithm determines the baseload for each energy type.
Building Occupancy Information
– The ENERGY STAR Portfolio Manager® requires and applies building occupancy information to provide an ENERGY STAR score.
– Screaming Power weather normalization algorithm requires and foresees occupancy information as a coefficient in its linear regression model.
Weather Information
– The ENERGY STAR Portfolio Manager® relies only on the Degree Days as the sum of HDD and CDD. It concludes that other weather parameters do not have a significant impact on energy consumption.
– Screaming Power weather normalization algorithm not only relies on temperature but also it requires solar radiation, humidity, wind speed as weather information as Screaming Powers research has shown impacts in other parameters other than HDD and CDD.
Active and Passive Baseload
– The ENERGY STAR Portfolio Manager® does not calculate Active or Passive Baseload for its weather normalization process.
– Screaming Power weather normalization algorithm requires and calculates Active Baseload and Passive Baseload for its weather normalization process.
Heating and Cooling Load
– The ENERGY STAR Portfolio Manager® does not calculate Heating Load and Cooling Load for its weather normalization process.
– Screaming Power weather normalization algorithm requires and calculates Heating Load and Cooling Load for its weather normalization process.
Properties of Building/Structure
– The ENERGY STAR Portfolio Manager® may receive (optional) manual input from the users on the materials and types of materials/insulation a property used of to build.
– Screaming Power weather normalization algorithm through its regression model automatically predicts (as a coefficient) properties (1) mass and insulation of the structure, (2) size, orientation, and composition of the windows in the structure, (3) structural features or defects that allow heats to escape from the structure, and so on.
Forecasted Energy Use Intensity
– The ENERGY STAR Portfolio Manager® does not generate or plot the forecasted energy use intensity.
– Screaming Power weather normalization algorithm generates and plots the forecasted energy use intensity.
Data Validation
– The ENERGY STAR Portfolio Manager® performs data validation at the time of the manual input and does not employ any machine learning techniques for data validation.
– Screaming Power weather normalization algorithm employs a machine learning technique for data validation in conjunction with a z-score threshold value to identify anomalous data values.
Data Remediation
– The ENERGY STAR Portfolio Manager® does not facilitate data remediation and assists users to ensure that the input data is valid.
– Screaming Power weather normalization algorithm facilitates data remediation through various techniques including, for example, missing or erroneous values may be replaced using data that is interpolated from existing values, an average of existing data or a mean of existing data. More specifically, the Screaming Power data remediation uses a predictive model to replace data that is indicative of an error.
Regression Model of CDD and HDD
– The ENERGY STAR Portfolio Manager® generates the linear regression model of HDD and CDD.
– Screaming Power weather normalization algorithm generates both linear and non-linear regression models of HDD and CDD.
Eligibility Criteria or Constraints
– Imposed by ENERGY STAR Portfolio Manager®
The ENERGY STAR Portfolio Manager® can measure and track the energy and water use of any building over time. For certain properties, one can go a step further and benchmark their energy use relative to similar buildings nationwide. In ENERGY STAR Portfolio Manager®, this benchmark is called an ENERGY STAR score and is expressed on a scale of 1 to 100. To get an ENERGY STAR score, a property must meet several criteria related to its Property type, Property use details, and Energy data.
The ENERGY STAR Portfolio Manager® imposes restrictions on buildings that seek to obtain a score. The ENERGY STAR Portfolio Manager® does not impose the listed restrictions on weather normalized metrics. Screaming Power is providing weather normalized metrics with no eligibility criteria, while ENERGY STAR Portfolio Manager® is providing ENERGY STAR Scores with eligibility requirements, and weather normalized metrics with less stringent requirements.
The examples are U.S. centric/outdated and differ for Canadian properties, for example, K-12 schools in Canada have a minimum area of 100m2 or 1,076 ft2. Some of the information is available on the Canadian NRCan page.
– Property types
The ENERGY STAR score compares a building to its peer group of buildings in the national population. This peer group is identified through nationally representative survey data, such as the Commercial Building Energy Consumption Survey (CBECS), a survey conducted every four years by the U.S. Department of Energy. The eligibility criteria for a property in the US are as follow:
o more than 50 percent of a building’s gross floor area (excluding parking lots and garages) must be defined as one of the eligible property types
o The parking garage cannot be bigger than a building, i.e., the combined floor area of all enclosed and unenclosed parking structures cannot exceed the total gross floor area of the building.
o One cannot have more than 25% of floor space ineligible to be a property type.
o The Canadian buildings are identified through the Survey of Commercial and Institutional Energy Use (SCIEU), allowing for Canadian buildings to be modeled and compared to other Canadian buildings. It is also conducted periodically and is the Canadian equivalent to CBECS. This is an important distinction for Canadian clients.
– Property use details
The ENERGY STAR Portfolio Manager® requires entering data for key property use details. To be eligible to receive a 1 – 100 ENERGY STAR score, there are minimum and maximum thresholds for these values. These limits are designed to make sure that a building operates similarly to the peer group used for comparison. To be eligible to receive a 1 – 100 ENERGY STAR score, for a building in the US, for example, must meet the thresholds listed below:
o All buildings must be at least 5,000 sq. ft. (i.e., 1,076 sq. ft. for a Canadian property) with four exceptions: (i) Banks may be as small as 1,000 sq. ft. (same as Canada), (ii) Religious worship facilities may be as small as 1,000 sq. ft. (same as Canada), (iii) Hospitals must be at least 20,000 sq. ft. (1076 sq. ft. for a Canadian hospital), (iv) Data centers do not have a square-foot minimum
o All buildings must be in operation at least 30 hours per week, with two exceptions: (i) This does not apply to buildings that are not asked for hours of operation, such as hotels and hospitals and (ii) This does not apply to religious worship facilities.
o All buildings must have at least 1 worker during the main shift, with an exception to K-12 schools in the U.S., but it applies to K-12 schools in Canada.
o Hospitals must have at least one bed setup and staffed for use.
o Offices, bank branches, financial offices, and courthouses must have at least 1 Personal Computer (PC)
o Residence halls/ dormitories and barracks must have at least 5 rooms
o Retail stores must have at least one cash register, an exterior entrance to the public, be a single store only
o Senior care facilities must not have an average number of residents that exceeds the resident capacity
o Religious worship facilities must have at least 25 seats and no more than 4,000 seats
– Energy data
To receive a 1 – 100 ENERGY STAR score, one must enter energy meters that account for all energy use for all fuel types in the whole building, regardless of who receives or pays the utility bills. To ensure accurate analysis, EPA applies limitations on this data as follows:
o One must include all energy used by the property (e.g., electricity, gas, oil, steam, onsite renewable energy, etc.)
o There must be at least 12 full consecutive calendar months of energy data for all active meters and all fuel types.
– Imposed by Screaming Power Algorithm
The Screaming Power weather normalization algorithm can track the energy use of any building over time. Currently, it does not track waste information and does not benchmark water use. Unlike ENERGY STAR Portfolio Manager®, the Screaming Power algorithm does not impose any constraints on a property on its property type, use details, and energy data to be able to perform weather normalization.
– Property types
o Screaming Power weather normalization algorithm considers properties of any type
– Property use details
o Regardless of the percentage of the usage of a property, the Screaming Power weather normalization algorithm can be applied to any property
– Energy data
o At present, the Screaming Power weather normalization algorithm can be applied to only electricity and natural gas. Any other energy types can be fed into the algorithm. We also do not require strictly 12-months energy data, meaning that the algorithm can work on any chunk of data from any period in a year
o Import data as an input and that it is automatically retrieved
In the following, we summarize our findings based on the detailed comparison above.
6.1 Summary of the Comparison
Criteria | Portfolio Manager | Screaming Power |
Baseline Year | Calculated as the first year for which a property has 12 full months of data. | Calculated primarily based on the fiscal year. |
Electric Demand and Cost | Calculates metrics including Annual Maximum Demand (kW), Annual Maximum Demand (MM/YYYY), Annual Maximum Demand (Meter Name & ID), Annual Demand Cost ($), which are not weather normalized. | Calculates Annual Maximum Demand (kW) and Annual Demand Cost ($) metrics which can be weather normalized. |
Eligibility Criteria | ENERGY STAR Portfolio Manager® imposes eligibility criteria on Property types, Property use details, and Energy data. | Imposes no eligibility criteria. |
GHG Emission Calculation | Calculates the total GHG emission based on Direct and Indirect emissions, which are associated with on-site fuel combustion and off-site avoided emission. | Calculates the total GHG emission also based on the Direct and Indirect emissions. But the on-site fuel combustion was not considered. |
HDD and CDD Calculations | Calculates the HDD and CDD based on the 30 years’ average as 65 degrees Fahrenheit. | Calculates HDD and CDD based on 18 degrees Celsius as the 30 years’ average, which should be precisely 18.33 degree Celsius following the standard unit conversion. |
Minimum Property Size | For a property in the US, for example, a minimum property size of 5,000 sq. ft. (i.e., 1,076 sq. ft. for a Canadian property) to be analyzed and receive a score, except a bank must be at least 1,000 sq. ft. (same as Canada), a hospital must be at least 20,000 sq. ft. (1076 sq. ft. for a Canadian hospital), a religious worship facility must be at least 1,000 sq. ft. and data centers have no minimum requirements. | No constraints on minimum property |
Minimum Weekly Operating Hours | A minimum of 30 Weekly Operating Hours is required to be analyzed and to receive a score by Portfolio Manager- for a property, except for hotels/hospitals and religious worship facilities. | No constraints on weekly operational hours. |
Model and Regression Analysis | For each individual fuel type, a series of linear regressions is performed to determine the equation of the best-fit line. | For each fuel type, linear model and non-linear models (Neural Network) are used for forecasting weather normalized energy. |
Site EUI | Provide the Site EUI metric in FPS unit. | Provide the Site EUI metric in MKS unit. |
Waste Tracking | Can track Waste regardless of its type. Currently, Portfolio Manager- tracks 29 different types of Waste/Materials. | Does not take care of waste tracking. |
Water Benchmarking | Tracks the amount of water a property uses and compares water use for that property over time or against other properties under a portfolio account. | Does not perform water benchmarking at this time, since it presently focuses on energy management. |
Weather Normalized Site EUI | Calculates the weather normalized EUI to show the actual energy intensity. | Does not calculate and does not require the weather normalized EUI value. |
Building Occupancy Information | Requires and applies building occupancy information to provide an ENERGY STAR score. | Requires and automatically foresees occupancy information as a coefficient in its regression models. |
Determining Baseload Value | Does not determine the baseload for each energy type. | Determines the baseload for each energy type. |
Weather Information | Relies only on the Degree Days as the sum of HDD and CDD. | Not only relies on temperature but also it requires solar radiation, humidity, and wind speed as weather information. |
Active and Passive Baseload | Does not calculate Active Baseload and Passive Baseload for its weather normalization process. | Requires and calculates Active Baseload and Passive Baseload for its weather normalization process. |
Heating and Cooling Load | Does not calculate Heating Load and Cooling Load for its weather normalization process. | Requires and calculates Heating Load and Cooling Load for its weather normalization process. |
Properties of Building/Structure | Receives (optional) manual input from the users on the materials and types of materials/insulation a property used to be built. | Through its regression model automatically predict (as a coefficient) properties like (1) mass and insulation of the structure, (2) size, orientation, and composition of the windows in the structure, (3) structural features or defects that allow heats to escape from the structure, and so on. |
Forecasted Energy Use Intensity | Does not generate or plot the forecasted energy use intensity. | Generates and plots the forecasted energy use intensity. |
Data Validation | Performs data validation at the time of the manual input and does not employ any machine learning techniques for data validation. | Employs a machine learning technique for data validation in conjunction with a z-score threshold value to identify anomalous data values. |
Data Remediation | Does not facilitate data remediation and users need to ensure that the input data is valid. | Facilitates data remediation through various techniques including, for example, missing or erroneous values may be replaced using data that is interpolated from existing value, an average of existing data or a mean of existing data. More specifically, the Screaming Power data remediation uses a predictive model to replace data that is indicative of an error. |
Regression Model of CDD and HDD | Generates the linear regression model of HDD and CDD. | Generates both linear and non-linear regression models of HDD and CDD. |
7. Other Features in ENERGY STAR Portfolio Manager®
Currently, the Screaming Power’s weather normalization algorithm is considering residential and commercial buildings uniformly. The energy consumption rate and in some cases commercial buildings producing their own energy and transmitting it, for example, should not be measured at the same level. Therefore, the Source Energy and Site Energy should be considered, as well as the Primary Energy and the Secondary Energy, to make the Screaming Power weather normalization algorithm more accurate.
Energy Type | USA Ratio | Canada Ratio |
Electricity (Grid) | 3.14 | 2.05 |
Electricity (On Site) | 1.00 | 1.00 |
Natural Gas | 1.05 | 1.02 |
Fuel Oil (1, 2, 4, 5, 6, Diesel, Kerosene) | 1.01 | 1.01 |
Propane & Liquid Propane | 1.01 | 1.03 |
Steam | 1.20 | 1.20 |
Hot Water | 1.20 | 1.20 |
Chilled Water | 1.00 | 0.71 |
Wood | 1.00 | 1.00 |
Coal/Coke | 1.00 | 1.00 |
Other | 1.00 | 1.00 |
There is an excellent tool called Greenhouse Gas Equivalencies Calculator. The calculator may help us understand “what does it mean reducing carbon dioxide (CO2) emissions by 1 million metric tonnes” by translating abstract measurements into concrete terms that we can understand, such as the annual emissions from cars, households, or power plants. This calculator can be useful in communicating greenhouse gas reduction strategy, reduction targets, or other initiatives aimed at reducing greenhouse gas emissions.
8. Alternative Methods for Weather Normalization
8.1. Weather-Normalized Energy Consumption Using HDD and CDD
The algorithm proposed by Robin Deliso Woodcock from ENERNOC was implemented on June 30, 2015. The algorithm was described on https://www.energysmart.enernoc.com. The proposed algorithm only verifies the performance efficiency of two or more properties under different weather conditions. And, it does not normalize the consumed energy value itself.
Step-by-Step Weather Normalization for Energy
Step 1. Sum the total heating degree days (HDD) and cooling degree days (CDD) for one building for a period of time
o Total Degree Days = HDD + CDD
Step 2. Divide the total kWh used at that building during the same period of time by the total number of heating and cooling degree days
o Average Energybuilding1 = Total Energy in kWh / Total Degree Days
Step 3. Repeat the same calculation for a second building
o Average Energybuilding2
Step 4. Compare Average Energybuilding1 and Average Energybuilding2
8.2. Linear Regression Analysis of Energy Consumption Data using Degree Days
8.2.1. For the Data with Regular Interval
The end goal of performing linear regression analysis is to correlate energy-consumption data with the degree-day data as discussed on Source: http://www.degreedays.net/regression-analysis. The article suggests that most buildings follow a weekly routine, which means that weekly energy-consumption data is typically a good option for regression analysis.
The equation enables one to estimate kWh from degree days. By plugging a known HDD or CDD figure into the equation one can calculate the predicted energy consumption for the period that the HDD/CDD covered.
One can then compare the predicted energy consumption with the actual energy consumption for that period. We would typically do this to see whether the energy efficiency has gotten better or worse than it was in the period that one did the original regression analysis for.
The R2 value is basically a measure of how good the correlation is. The closer the R2 value is to 1, the better the correlation. A good correlation between degree days and energy consumption indicates that the methodology is sound and that the heating/cooling system is working well. In other words, the higher the R2, the better.
In general, the R2 of 0.75 indicates a reasonable correlation between energy consumption and degree days. 0.9 or above is very good. An R2 much below 0.7 or so is likely an indication that the heating control is either very poor, or that the analysis methodology needs to be improved (e.g., wrong base temperature, irregular building occupancy that has not been corrected for, heating/cooling metered together with other energy consumption that varies considerably throughout the year).
The formula to calculate the gradient, intercept, and R2, to help determine the optimal base temperature: In theory, the base temperature that produces the highest R2 should be the optimal base temperature of the building. The formulas are: SLOPE, INTERCEPT, and RSQ.
8.2.2. An Improved Correlation Method for Irregular Data
Correlating energy usage with degree days, as described above, works well when all the energy-consumption records cover identical periods of time. It is ideal for linear regression analysis of daily or weekly data. The above method does not work properly for irregular periods of consumption. The main problem with correlating energyusage with degree days covering irregular periods is the baseload energy consumption. Because, the method above assumes that the baseload is a constant number, but this assumption only makes sense if the periods of consumption are all the same length.
Because different months have different lengths, using a constant figure for baseload kWh causes slight inaccuracies in correlations of monthly energy consumption with monthly degree days. The more irregular one’s consumption records, the greater these inaccuracies become.
The main idea is “instead of correlating energy consumption with degree days, correlate energy consumption per day with degree days per day.”
8.3. Discussion
Problems with Common Degree-Day-Based Methods
The Base Temperature Problem
In degree-day theory, the base temperature, or “balance point” of a building is the outside temperature above which the building does not require heating or cooling.
Different buildings are heated to different temperatures. Although it is often recommended that office buildings be heated to 19°C, however, the office buildings are often several degrees warmer. Industrial buildings are often several degrees cooler.
Average internal heat gain varies from building to building. A crowded office packed with people and equipment will have a much higher average internal heat gain than a sparsely-filled office with a high ceiling. The internal heat gain from industrial processes depends on the processes in question.
The Baseload Energy Problem
Any baseload energy needs to be removed from energy-consumption figures before they can be weather normalized. This is fine in theory, but very difficult in practice. As described above, linear regression is one way to calculate the baseload energy (plotting degree days on the x-axis against energy consumption on the y-axis, and taking the baseload energy from the point at which the regression line crosses the y-axis). The accuracy of this method is highly dependent on the degree days having an appropriate base temperature, which introduces all the base-temperature problems described above.
Energy consumption will never give a “perfect” correlation with degree days of any base temperature, so, even if one has degree days with a range of base temperatures available, one can never be certain that he is picking the appropriate base temperature just by looking at the correlations. And, since the y-axis intercept varies so significantly with the base temperature chosen, it will consequently be impossible to obtain the baseload energy accurately.
The Meter Reading Problem
As mentioned previously, degree days typically come as weekly or monthly values. So, to compare or correlate energy consumption with degree days, one need meter readings that are taken at the start of each week or month. If someone is taking those meter readings manually, he should take them at midnight, and often on weekends.
Of course, it is rarely convenient to take manual meter readings at midnight or on weekends, so it is common for such readings to be taken up to several days early or late. This can introduce a significant inaccuracy into degree-day-based calculations.
The “Ideal” Temperature Problem
When the outside temperature is close to the base temperature of the building, the building will often require little or no heating. Degree-day-based calculations are particularly inaccurate under such circumstances and calculations are typically much less reliable. The inaccuracies introduced by the base temperature problem and the intermittent heating problem are exaggerated, making it difficult to place much confidence in results.
Suggestions for Improvement: Using Degree Days Wisely
Use the most appropriate degree-day data one can. For example, one should aim for data that is (i) From a weather station nearest to the building to be analyzed (ii) Calculated accurately from good-quality temperature readings (iii) In the timescale that is most appropriate for the analysis. For regression analysis, weekly data is often best for smoothing over the effects of weekend-related inaccuracies, but of course, one need weekly energy-consumption data to match it. If someone has irregular periods of consumption, he should sum daily degree days to match them.
Ignore periods with an “ideal” outside temperature: The “ideal” temperature problem occurs when the outside temperature is such that the building requires minimal heating or cooling. Since the standard approaches to degree-day-based analysis are particularly inaccurate under such circumstances, it is often best to simply leave these periods out of regression analysis.
Get interval metering: Interval metering has only become readily available in recent years, and much of the energy-management literature has yet to catch up. Analysis of the high-resolution detail contained within interval data such as half-hourly data can, in seconds, reveal patterns of energy wastage that could never be revealed by weekly or monthly regression analysis.
9. Conclusion on the Comparison
Our findings find that the scope of ENERGY STAR Portfolio Manager® is wide and has a substantial advantage in the industry as it is well thought out and is known as a “standard” toolset in the market. It can track and manage not only the energy information but also the water and waste information. The water usage information is not weather-normalized. In contrast, the Screaming Power weather normalized algorithm is solely energy-focused although it can be extended to handle other utility information (e.g., water and waste) and environmental factors that have a potential impact on the planet and on the climate change.
In summary, the key features of ENERGY STAR Portfolio Manager® include: (1) managing energy and water consumption and tracking the waste for any building through a web based application and standardized API’s, (2) managing energy information and weather normalized energy data (i.e., the weather information comprises only the factor that performs best in terms of normalization impact on the energy use), (3) providing an ENERGY STAR score between 1 and 100 for eligible buildings, and in particular commercial buildings, (4) measuring the carbon footprint (i.e., GHG emissions) of a property, (5) setting the investment priorities to improve the energy and water conservation, (6) verifying and tracking the energy and water savings, (7) generating and sharing the performance of a property, and (8) helping individuals and organizations in receiving the recognition for energy conservation.
The weather information comprises all the factors among the solar radiation, outside temperature, humidity, and wind speed. As compared to ENERGY STAR Portfolio Manager®, the key features of Screaming Power weathernormalization algorithm in accordance with the claims in the patent include: (1) determining a baseload value based on the energy use intensity value and the weather information, (2) determining the active baseload value and passive baseload value based on the energy use intensity value and the weather information, (3) determining the heating load and the cooling load based on the energy use intensity value and the weather information, (4) generating a temperature-normalized energy use intensity value by taking into consideration the properties of the building (i.e., these properties comprise one or more of a coefficient that represents the mass and insulation of the structure, a coefficient that represents the size, orientation, and composition of the windows in the structure, a coefficient that represents structural features or defects that allow heat to escape from the structure), (5) determining the cost of energy use, (6) generating a forecasted energy use intensity value representing energy usage by a building over a time period and weather information for the structure corresponding to the time period, and (7) determining the forecasted values for the cost of energy use.
One major variance between the ENERGY STAR Portfolio Manager® method and the Screaming Power’s weather normalization is that the former performs the weather normalization for residential buildings and assigns an ENERGY STAR score for commercial or industrial buildings, in contrast, the latter, i.e., Screaming Power’s weather normalization algorithm perform weather normalization regardless of the types of the properties, i.e., the Screaming Power performs weather normalization both for the commercial and residential buildings.
One of the benefits of Screaming Power weather normalization algorithm over the ENERGY STAR Portfolio Manager® is its ability to forecast the energy usage intensity using the non-linear regression models for forecasting. The Screaming Power weather normalization algorithm employs a deep machine learning technique (i.e. Neural Network) to accurately predict the energy use for any future period of time.
On its drawback, the Screaming Power weather normalization algorithm does not calculate the Annual Maximum Demand (MM/YYYY) and Annual Maximum Demand (Meter Name/ID) in its current version, which is helpful to see which period or time of the year has the highest demand and which meter is reporting the highest energy demand, respectively. We also may extend the algorithm to water benchmarking as clean water conservation also requires significant attention. The Screaming Power weather normalization algorithm does not currently support localization factor, which might have an impact on energy consumption.
Author: Francis Palma, Ph.D., Research Scientist, Screaming Power Inc., Picton, ON, Canada.
Email: fpalma@ScreamingPower.com
References
Following references were useful in this research and for the preparation of this article include:
[1] ENERGY STAR Score, ENERGY STAR Portfolio Manager® Technical Reference, Source: https://portfoliomanager.energystar.gov/pdf/reference/ENERGY%20STAR%20Score.pdf, Last updated on September 2014.
[2] Climate and Weather Effects, ENERGY STAR Portfolio Manager® Technical Reference, Source: https://www.energystar.gov/sites/default/files/tools/Climate_and_Weather_August_2017_EN_508.pdf, Last updated on August 2017.
[3] Thermal Energy Conversion Factors, ENERGY STAR Portfolio Manager® Technical Reference, Source: https://portfoliomanager.energystar.gov/pdf/reference/Thermal%20Conversions.pdf, Last updated on August 2015.
[4] Source Energy, ENERGY STAR Portfolio Manager® Technical Reference, Source:
https://portfoliomanager.energystar.gov/pdf/reference/Source%20Energy.pdf, Last updated on July 2013.
[5] Greenhouse Gas Emissions, ENERGY STAR Portfolio Manager® Technical Reference, Source: https://www.energystar.gov/sites/default/files/tools/GHG_Emissions_August_2017_EN_508.pdf, Last updated on August 2017.
[6] ENERGY STAR Portfolio Manager®:
[7] Green Power, ENERGY STAR Portfolio Manager® Technical Reference, Source:
https://portfoliomanager.energystar.gov/pdf/reference/Green%20Power.pdf, Last updated on July 2013.
Appendix A
Basic Definition of the Terms
Yearly Baseline:
The yearly baseline is the minimum or baseline energy usage for a year that excludes any weather impact on the energy use.
Baseline Year:
The Baseline Year is a historic point of comparison that can be used to track changes and improvements for a property over time.
Year Ending Date:
The Year Ending Date is the last day of a 12-month period based on which a set of metrics are calculated. Being known as a Metric Year, it starts on the first day of one month, and ends 12 months later, on the last day of the previous month, for example, 6/1/2015 to 5/31/2016.
Electric Demand (kW)
is the highest measured rate of one’s electricity use for each bill. It is also known as Peak Demand, On-Peak Demand, Load, etc.
Electric Demand Cost ($)
is the cost that you are charged for electric demand on each bill.
Site Energy Use
is the annual amount of all the energy your property consumes on-site, as reported on your utility bills. The Site EUI is the Site Energy Use divided by the total property square foot.
Weather Normalized Site Energy
is the energy a property would have consumed during 30-year average weather conditions. The Weather Normalized Site EUI is the Weather Normalized Site Energy divided by total property size.
Source Energy Use
is the total amount of raw fuel that is required to operate a property. In addition to what the property consumes on-site, the source energy includes losses that take place during generation, transmission, and distribution of the energy, thereby enabling a complete assessment of energy consumption resulting from building operations. For this reason, Source EUI is the best way to quantify the energy performance of commercial buildings.
Heating Degree Days (HDD)
is the equivalent number of days one would have to heat a building by 1 degree to accommodate the heating requirement. For example, if one has a day on which the temperature is 55oF degrees, that day is worth 10 Heating Degree Days because it is 10 degrees below 65o HDD is calculated in this way for each day of the year and summed up to get the total annual HDD.
Cooling Degree Days (CDD)
is the equivalent number of days one would have to cool his building by 1 degree to accommodate the cooling requirement. For example, if one has a day on which the temperature is 80oF degrees, that day is worth 15 Cooling Degree Days because it is 15 degrees above the 65o CDD is calculated in this way for each day of the year and summed up to get the total annual CDD.
Primary Energy
is the raw fuel that is burned to create heat and electricity, such as natural gas, fuel oil, or coal.
Secondary Energy
is the energy product created from a raw fuel, such as electricity (purchased from the grid) or heat (received from a district steam system).
Appendix B
The Property Types in Portfolio Manager
One can use ENERGY STAR Portfolio Manager® to benchmark the performance of any building, no matter what type it is or what it is used for. There are 18 broad categories and, within those, more than 80 primary functions built into ENERGY STAR Portfolio Manager®. This makes it easy for someone to identify and compare similar buildings within one’s portfolio.
18 Broad Category
- Banking/Financial Services
- Education
- Entertainment/Public Assembly
- Food Sales and service
- Healthcare
- Lodging/Residential
- Manufacturing/Industrial
- Mixed Use
- Office
- Parking
- Public Services
- Religious Worship
- Retail
- Technology/Science
- Services
- Utility
- Warehouse/Storage
- Other (select this option if the property doesn’t fit into any of the categories above)
The Sub-Categories:
Banking/Financial Services
- Bank Branch
- Financial Office
Education
- Adult Education
- College/University
- K-12 School
- Pre-school/Daycare
- Vocational School
- Other – Education
Entertainment/Public Assembly
- Aquarium
- Bar/Nightclub
- Bowling Alley
- Casino
- Convention Center
- Fitness Center/Health Club/Gym
- Ice/Curling Rink
- Indoor Arena
- Movie Theater
- Museum
- Performing Arts
- Race Track
- Roller Rink
- Social/Meeting Hall
- Stadium (Closed)
- Stadium (Open)
- Swimming Pool
- Zoo
- Other – Entertainment/Public Assembly
- Other – Recreation
- Other – Stadium
Food Sales and Service
- Bar/Nightclub
- Convenience Store with Gas Station
- Convenience Store without Gas Station
- Fast Food Restaurant
- Food Sales
- Food Service
- Restaurant
- Supermarket/Grocery Store
- Wholesale Club/Supercenter
- Other – Restaurant/Bar
Healthcare
- Hospital (General Medical & Surgical)
- Medical Office
- Outpatient Rehabilitation/Physical Therapy
- Residential Care Facility
- Senior Care Community
- Urgent Care/Clinic/Other Outpatient
- Other – Specialty Hospital
Lodging/Residential
- Barracks
- Hotel
- Multifamily Housing
- Prison/Incarceration
- Residence Hall/Dormitory
- Senior Care Community
- Single Family Home
- Other – Lodging/Residential
Manufacturing/Industrial
- Manufacturing/Industrial Plant
Mixed Use
- Mixed Use Property
Office
- Medical Office
- Office
- Veterinary Office
- Other – Office
Parking
- Parking
Public Services
- Courthouse
- Drinking Water Treatment & Distribution
- Fire Station
- Library
- Mailing Center/Post Office
- Police Station
- Prison/Incarceration
- Social/Meeting Hall
- Transportation Terminal/Station
- Wastewater Treatment Plant
- Other – Public Service
Religious Worship
- Worship Facility
Retail
- Automobile Dealership
- Convenience Store with Gas Station
- Convenience Store without Gas Station
- Enclosed Mall
- Lifestyle Center
- Retail Store
- Strip Mall
- Supermarket/Grocery Store
- Wholesale Club/Supercenter
- Other – Retail/Mall
Technology/Science
- Data Center
- Laboratory
- Other – Technology/Science
Data Center
- Personal Services (Health/Beauty, Dry Cleaning, etc)
- Repair Services (Vehicle, Shoe, Locksmith, etc)
- Other – Services
Utility
- Drinking Water Treatment & Distribution
- Energy/Power Station
- Wastewater Treatment Plant
- Other – Utility
Warehouse/Storage
- Self-Storage Facility
- Distribution Center
- Non-Refrigerated Warehouse
- Refrigerated Warehouse
Other
- Other – Education
- Other – Entertainment/Public Assembly
- Other – Recreation
- Other – Stadium
- Other – Restaurant/Bar
- Other – Specialty Hospital
- Other – Lodging/Residential
- Other – Office
- Other – Public Service
- Other – Retail/Mall
- Other – Technology/Science
- Other – Services
- Other – Utility
- Other – Other
Among more than 80 property type, 21 property types are also eligible to receive an ENERGY STAR score. The property types that are eligible to receive an ENERGY STAR score.
In the US, The Eligible Property Types to Receive a Score Are:
- Bank Branch
- Barracks
- Courthouse
- Data Center
- Distribution Center
- Financial Office
- Hospital (General Medical & Surgical)
- Hotel
- K-12 School
- Medical Office
- Multifamily Housing
- Non-refrigerated warehouse
- Office
- Refrigerated Warehouse
- Residence Hall/ Dormitory
- Retail Store
- Senior Care Community
- Supermarket/Grocery Store
- Wastewater Treatment Plant
- Wholesale Club/Supercenter
- Worship Facility
In Canada, The Eligible Property Types to Receive a Score are:
- Financial Office
- K-12 School
- Hospitals
- Medical Office
- Office
- Residential Care Facility
- Senior Care Community
- Supermarket/Grocery Store (covers supermarket/grocery store, food sales, and convenience store with or without gas station)